ModiaResult Documentation
Package ModiaResult defines an abstract interface for simulation results with a potentially segmented time axis (on different segments of the time axis, different variables might be defined) and provides overloaded methods for:
- Dictionaries with String keys,
- DataFrame tables,
ModiaResult.ResultDict(special dictionary with all features of the interface).
Additionally, operations on simulation results are provided, especially to produce line plots in a convenient way based on
- GLMakie (interactive plots in an OpenGL window),
- WGLMakie (interactive plots in a browser window),
- CairoMakie (static plots on file with publication quality),
- PyPlot (plots with Matplotlib from Python),
- NoPlot (= all plot calls are ignored; NoPlot is a module in ModiaResult), or
- SilentNoPlot (= NoPlot without messages; SilentNoPlot is a module in ModiaResult).
More details:
Example
Assume that the result data structure is available, then the following commands
import ModiaResult
# Define plotting software globally
ModiaResult.activate("PyPlot") # or ENV["MODIA_PLOT"] = "PyPlot"
# Execute "using ModiaPlot_<globally defined plot package>"
ModiaResult.@usingModiaPlot # = "using ModiaPlot_PyPlot"
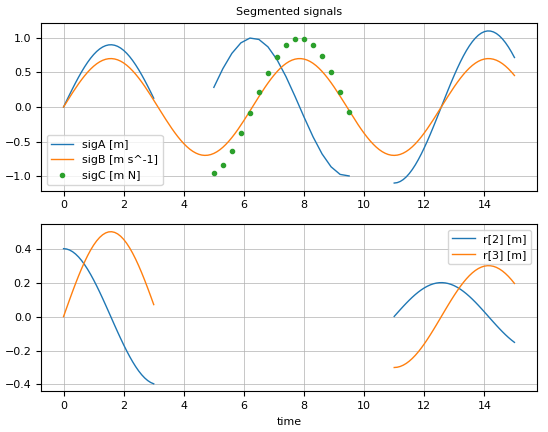
# Generate line plots
plot(result, [("sigA", "sigB", "sigC"), "r[2:3]"])generate the following plot:
Abstract Result Interface
For every result data structure a few access functions have to be defined (for details see Abstract Interface). Most importantly:
(timeSignal, signal, signalType) = ModiaResult.rawSignal(result, name)Given the result data structure result and a variable name::AbstractString, return the result values of the independent variable (= timeSignal), the corresponding result values of the variable (= signal) and the type of the signal signalType::SignalType). The following figure sketches the returned timeSignal and signal data structures:
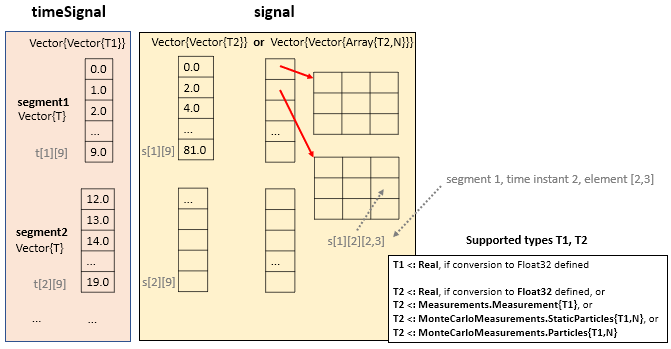
Other signal types might be mapped to this basic signal type by introducing views.
Installation
All packages are registered and are installed with:
julia> ]add ModiaResult
        add ModiaPlot_GLMakie       # if plotting with GLMakie desired
        add ModiaPlot_WGLMakie      # if plotting with WGLMakie desired
        add ModiaPlot_CairoMakie    # if plotting with CairoMakie desired
        add ModiaPlot_PyPlot        # if plotting with PyPlot desired
If you have trouble installing ModiaPlot_PyPlot, see Installation of PyPlot.jl
Installation of PyPlot.jl
ModiaPlot_PyPlot.jl uses PyPlot.jl which in turn uses Python. Therefore a Python installation is needed. Installation might give problems in some cases. Here are some hints what to do (you may also consult the documentation of PyPlot.jl).
Before installing ModiaPlot_PyPlot.jl make sure that PyPlot.jl is working:
]add PyPlot
using PyPlot
t = [0,1,2,3,4]
plot(t,2*t)
If the commands above give a plot window. Everything is fine.
If you get errors or no plot window appears or Julia crashes, try to first install a standard Python installation from Julia:
# Start a new Julia session
ENV["PYTHON"] = ""    # Let Julia install Python
]build PyCall
exit()   # Exit Juila

# Start a new Julia session
]add PyPlot
using PyPlot
t = [0,1,2,3,4]
plot(t,2*t)
If the above does not work, or you want to use another Python distribution, install a Python 3.x distribution that contains Matplotlib, set ENV["PYTHON"] = "<path-above-python-installation>/python.exe" and follow the steps above. Note, ModiaPlot_PyPlot is based on the Python 3.x version of Matplotlib where some keywords are different to the Python 2.x version.
Release Notes
Version 0.3.8
- Better handling if some input arguments are
nothing. - Bug corrected when accessing a vector element, such as
mvec[2]. - Documentation slightly improved.
Version 0.3.7
- Replaced Point2f0 by Makie_Point2f that needs to be defined according to the newest Makie version.
Version 0.3.6
- Adapt to MonteCarloMeasurements, version >= 1.0 (e.g. pmean(..) instead of mean(..))
- Remove test71TablesRotationalFirst.jl from runtests.jl, because "using CSV" (in order that CSV.jl does not have to be added to the Project.toml file)
Version 0.3.5
- Project.toml: Added version 1 of MonteCarloMeasurements.
Version 0.3.4
- Project.toml: Added older versions to DataFrames, in order to reduce conflicts.
Version 0.3.3
- ModiaResult/test/Project.toml: DataStructures replaced by OrderedCollections.
Version 0.3.2
- DataStructures replaced by OrderedCollections.
- Version numbers of used packages updated.
Version 0.3.1
- Two new views on results added (SignalView and FlattenedSignalView).
Version 0.3
- Major clean-up of the function interfaces. This version is not backwards compatible to previous versions.
Version 0.2.2
- Overloaded AstractDicts generalized from
AbstractDict{String,T} where {T}toAbstractDict{T1,T2} where {T1<:AbstractString,T2}.
- Bug fixed.
Version 0.2.1
- Bug fixed:
<: Vectorchanged to<: AbstractVector
Version 0.2.0
- Abstract Interface slightly redesigned (therefore 0.2.0 is not backwards compatible to 0.1.0).
- Modules NoPlot and SilentNoPlot added as sub-modules of ModiaResult. These modules are activated if plot package "NoPlot" or "SilentNoPlot" are selected.
- Content of directory srcplot moved into src. Afterwards srcplot was removed.
- Directory test_plot merged into test (and then removed).
Version 0.1.0
- Initial version (based on the result plotting developed for ModiaMath).
Main developer
Martin Otter, DLR - Institute of System Dynamics and Control