Functions
This chapter documents the functions that a user of this package typically utilizes.
The following functions are available when prefixed with ModiaResult.
ModiaResult does not export any symbols.
(for example: import ModiaResult; ModiaResult.usePlotPackage("PyPlot")).
Some packages, such as Modia, export all the function names below and then the functions can be directly accessed.
(for example: using Modia; usePlotPackage("PyPlot")).
| Functions | Description |
|---|---|
@usingModiaPlot | Expands into using ModiaPlot_<PlotPackageName> |
usePlotPackage | Define the plot package to be used. |
usePreviousPlotPackage | Define the previously defined plot package to be used. |
currentPlotPackage | Return name defined with usePlotPackage |
resultInfo | Return info about the result as DataFrame table |
printResultInfo | Print info of the result on stdout. |
rawSignal | Return raw signal data given the signal name. |
getPlotSignal | Return signal data prepared for a plot package. |
defaultHeading | Return default heading of a result. |
signalNames | Return all signal names. |
timeSignalName | Return the name of the time signal. |
hasOneTimeSignal | Return true if one time signal present. |
hasSignal | Return true if a signal name is known. |
The following functions are available after @usingModiaPlot has been executed:
| Functions | Description |
|---|---|
plot | Plot simulation results in multiple diagrams/figures. |
saveFigure | Save figure in different formats on file. |
closeFigure | Close one figure |
closeAllFigures | Close all figures |
showFigure | Show figure in window (only GLMakie, WGLMakie) |
The following function is typically only used for testing
| Functions | Description |
|---|---|
ModiaResult.ResultDict | Return a new instance of a ResultDict dictionary. |
Functions of ModiaResult
The following functions are provided by package ModiaResult. Other useful functions are available in the Abstract Interface.
ModiaResult.@usingModiaPlot — Macro@usingModiaPlot()Execute using XXX, where XXX is the ModiaPlot package that was activated with usePlotPackage(plotPackage).
ModiaResult.usePlotPackage — FunctionusePlotPackage(plotPackage::String)Define the ModiaPlot package that shall be used by command ModiaResult.@usingModiaPlot. If a ModiaPlot package is already defined, save it on an internal stack (can be reactivated with usePreviousPlotPackage().
Possible values for plotPackage:
"GLMakie""WGLMakie""CairoMakie""PyPlot""NoPlot""SilentNoPlot"
Example
import ModiaResult

ModiaResult.usePlotPackage("GLMakie")

module MyTest
    ModiaResult.@usingModiaPlot

    t = range(0.0, stop=10.0, length=100)
    result = Dict{String,Any}("time" => t, "phi" => sin.(t))

    plot(result, "phi")  # use GLMakie for the rendering
endModiaResult.usePreviousPlotPackage — FunctionusePreviousPlotPackage()Pop the last saved ModiaPlot package from an internal stack and call usePlotPackage(<popped ModiaPlot package>).
ModiaResult.currentPlotPackage — FunctioncurrentPlotPackage()Return the name of the plot package as a string that was defined with usePlotPackage. For example, the function may return "GLMakie", "PyPlot" or "NoPlot" or or "", if no PlotPackage is defined.
ModiaResult.resultInfo — FunctionresultInfo(result)Return information about the result as DataFrames.DataFrame object with columns:
name::String, unit::String, nTime::String, signalType::String, valueSize::String, eltype::StringModiaResult.printResultInfo — FunctionprintResultInfo(result)Print info about result.
Example
using ModiaResult
using Unitful
ModiaResult.@usingModiaPlot

t = range(0.0, stop=10.0, length=100)
result = OrderedDict{String,Any}("time"=> t*u"s", "phi" => sin.(t)*u"rad")
printResultInfo(result)

# Gives output:
 # │ name  unit  nTime  signalType  valueSize  eltype
───┼───────────────────────────────────────────────────
 1 │ time  s     100    Independent ()         Float64
2 │ phi rad 100 Continuous () Float64ModiaResult.getPlotSignal — Function(xsig, xsigLegend, ysig, ysigLegend, ysigType) = getPlotSignal(result, ysigName; xsigName=nothing)Given the result data structure result and a variable ysigName::AbstractString with or without array range indices (for example ysigName = "a.b.c[2,3:5]") and an optional variable name xsigName::AbstractString for the x-axis, return
xsig::Vector{T1<:Real}: The vector of the x-axis signal without a unit. Segments are concatenated and separated by NaN.xsigLegend::AbstractString: The legend of the x-axis consisting of the x-axis name and its unit (if available).ysig::Vector{T2}or::Matrix{T2}: the y-axis signal, either as a vector or as a matrix of values without units depending on the given name. For example, ifysigName = "a.b.c[2,3:5]", thenysigconsists of a matrix with three columns corresponding to the variable values of"a.b.c[2,3]", "a.b.c[2,4]", "a.b.c[2,5]"with the (potential) units are stripped off. Segments are concatenated and separated by NaN.ysigLegend::Vector{AbstractString}: The legend of the y-axis as a vector of strings, whereysigLegend[1]is the legend forysig, ifysigis a vector, andysigLegend[i]is the legend for the i-th column ofysig, ifysigis a matrix. For example, if variable"a.b.c"has unitm/s, thenysigName = "a.b.c[2,3:5]"results inysigLegend = ["a.b.c[2,3] [m/s]", "a.b.c[2,3] [m/s]", "a.b.c[2,5] [m/s]"].ysigType::SignalType: The signal type ofysig(eitherModiaResult.ContinuousorModiaResult.Clocked).
If ysigName is not valid, or no signal values are available, the function returns (nothing, nothing, nothing, nothing, nothing), and prints a warning message.
Functions of Plot Package
The following functions are available after
ModiaResult.@usingModiaPlothas been executed. The documentation below was generated with ModiaPlot_PyPlot.
ModiaPlot_PyPlot.plot — Functionplot(result, names;
heading = "", grid = true, xAxis = nothing,
figure = 1, prefix = "", reuse = false, maxLegend = 10,
minXaxisTickLabels = false,
MonteCarloAsArea = true)Generate line plots of the signals of the result data structure that are identified with the names keys using the plot package defined with ModiaResult.@usePlotPackage(xxx). Possible values for xxx: "GLMakie", "WGLMakie", "CairoMakie", "PyPlot", "NoPlot", "SilentNoPlot").
result is any data structures that supports the abstract interface of ModiaResult. Currently these are:
result::ModiaResult.ResultDictresult::AbstractDict{String,T}result::DataFrames.DataFrameresultsupports theTables.jlinterface withTables.columnaccess(result) = true.
Argument names defines the diagrams to be drawn and the result data to be included in the respective diagram:
If
namesis a String, generate one diagram with one time series of the variable with keynames.If
namesis a Tuple of Strings, generate one diagram with the time series of the variables with the keys given in the tuple.If names is a Vector or a Matrix of Strings and/or Tuples, generate a vector or matrix of diagrams.
Note, the names (and their units, if available in the result) are automatically used as legends in the respective diagram.
A signal variable identified by a String key can be a scalar of type <:Number or an array of element type <:Number. A signal is defined by a vector of time values, a corresponding vector of signal values, and the signal type (continuous or clocked).
Note, before passing data to the plot package, it is converted to Float64. This allows to, for example, also plot rational numbers, even if not supported by the plot package. Measurements.Measurement{xxx} and MonteCarloMeasurements is specially handled.
Optional Arguments
heading::AbstractString: Optional heading above the diagram.grid::Bool: = true, to display a grid.xAxis::Union{AbstractString,Nothing}: Name of x-axis. IfxAxis=nothing, the independent variable of the result (usually"time"is used as x-axis.figure::Int: Integer identifier of the window in which the diagrams shall be drawn.prefix::AbstractString: String that is appended in front of every legend label (useful especially ifreuse=true).reuse::Bool: If figure already exists and reuse=false, clear the figure before adding the plot. Otherwise, include the plot in the existing figure without removing the curves present in the figure.reuse = trueis ignored for"WGLMakie"(because not supported).maxLegend::Int: If the number of legend entries in one plot command> maxLegend, the legend is suppressed. All curves have still their names as labels. In PyPlot, the curves can be inspected by their names by clicking in the toolbar of the plot on buttonEdit axis, curve ..and then onCurves.minXaxisTickLabels::Bool: = true, if xaxis tick labels shall be removed in a vector or array of plots, if not the last row (useful when including plots in a document). = false, x axis tick labels are always shown (useful when interactively zooming into a plot).MonteCarloAsArea::Bool: = true, if MonteCarloMeasurements values are shown with the mean value and the area between the minimum and the maximum value of all particles. = false, if all particles of MonteCarloMeasurements values are shown (e.g. if a value has 2000 particles, then 2000 curves are shown in the diagram).
Examples
import ModiaResult
using Unitful
# Generate "using xxx" statement
# (where "xxx" is from a previous ModiaResult.usePlotPackage("xxx"))
ModiaResult.@usingModiaPlot
# Construct result data
t = range(0.0, stop=10.0, length=100);
result = Dict{String,Any}();
result["time"] = t*u"s";
result["phi"] = sin.(t)*u"rad";
result["w"] = cos.(t)*u"rad/s";
result["a"] = 1.2*sin.(t)*u"rad/s^2";
result["r"] = hcat(0.4 * cos.(t), 0.5 * sin.(t), 0.3*cos.(t))*u"m";
# 1 signal in one diagram (legend = "phi [rad]")
plot(result, "phi")
# 3 signals in one diagram
plot(result, ("phi", "w", "a"), figure=2)
# 3 diagrams in form of a vector (every diagram has one signal)
plot(result, ["phi", "w", "r"], figure=3)
# 4 diagrams in form of a matrix (every diagram has one signal)
plot(result, ["phi" "w";
"a" "r[2]" ], figure=4)
# 2 diagrams in form of a vector
plot(result, [ ("phi", "w"), ("a") ], figure=5)
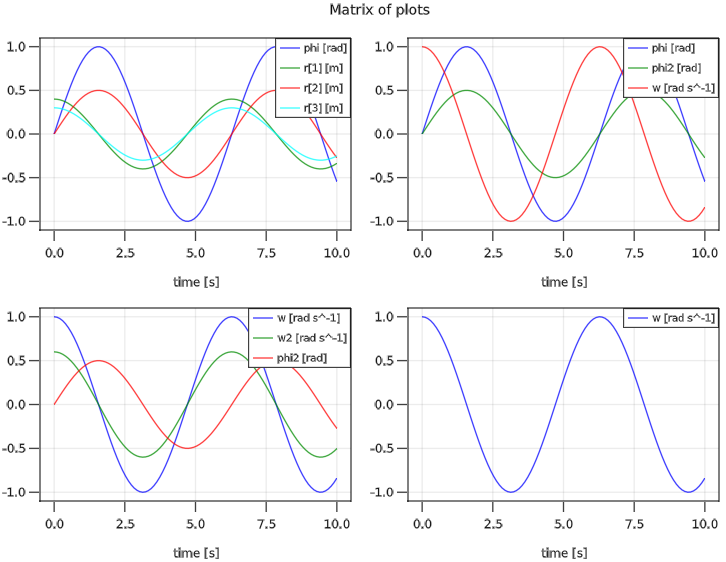
# 4 diagrams in form of a matrix
plot(result, [ ("phi",) ("phi", "w");
("phi", "w", "a") ("r[2:3]",) ],figure=6)
# Plot w=f(phi) in one diagram
plot(result, "w", xAxis="phi", figure=7)
# Append signal of the next simulation run to figure=1
# (legend = "Sim 2: phi [rad]")
result["phi"] = 0.5*result["phi"];
plot(result, "phi", prefix="Sim 2: ", reuse=true)Example of a matrix of plots:
ModiaPlot_PyPlot.saveFigure — FunctionsaveFigure(figure, file; kwargs...)Save figure on file. The file extension defines the image format (for example *.png).
| Plot package | Supported file extensions |
|---|---|
| GLMakie | png, jpg, bmp |
| WGLMakie | png |
| CairoMakie | png, pdf, svg, eps |
| PyPlot | depends on backend (png, pdf, jpg, tiff, svg, ps, eps) |
| NoPlot | Call is ignored |
Keyword arguments
- resolution: (width::Int, height::Int) of the scene in dimensionless units (equivalent to px for GLMakie and WGLMakie).
Example
import ModiaResult
ModiaResult.@usingModiaPlot
...

plot(..., figure=1)
plot(..., figure=2)

saveFigure(1, "plot.png")   # save in png-format
saveFigure(2, "plot.svg") # save in svg-formatModiaPlot_PyPlot.closeFigure — FunctioncloseFigure(figure)Close figure.
ModiaPlot_PyPlot.closeAllFigures — FunctioncloseAllFigures()Close all figures.
ModiaPlot_PyPlot.showFigure — FunctionshowFigure(figure)| Plot package | Effect |
|---|---|
| GLMakie | Show figure in the single window. |
| WGLMakie | Show figure in the single window. |
| CairoMakie | Call is ignored |
| PyPlot | Call is ignored |
| NoPlot | Call is ignored |
Example
import ModiaResult
ModiaResult.@usingModiaPlot
...
plot(..., figure=1)
plot(..., figure=2)
plot(..., figure=3)

showFigure(2)
showFigure(1)Functions for Testing
ModiaResult.ResultDict — TypeResultDict(args...; defaultHeading="", hasOneTimeSignal=true)Return a new ResultDict dictionary (is based on OrderedCollections.OrderedDict).
A key of the dictionary is a String. Key
"time"characterizes the independent variable.A value of the dictionary is a tuple
(timeSignal, signal, signalType)wheretimeSignal::Vector{AbstractVector},signal::Vector{AbstractVector}andsignalType::ModiaResult.SignalType.signal[i][j]is the signalValue at time instanttimeSignal[i][j]in segmenti`.
Example
using ModiaResult

time0 = [0.0, 7.0]
t     = ([time0], [time0], ModiaResult.Independent)

time1 = 0.0 : 0.1  : 2.0
time2 = 3.0 : 0.01 : 3.5
time3 = 5.0 : 0.1  : 7.0
sigA1 = sin.(time1)u"m"
sigA2 = cos.(time2)u"m"
sigA3 = sin.(time3)u"m"
sigA  = ([time1, time2, time3],
         [sigA1, sigA2, sigA3 ],
         ModiaResult.SignalType)
sigB  = ([time2], [sin.(time2)], ModiaResult.SignalType)
sigC  = ([time3], [sin.(time3)], ModiaResult.Clocked)

result = ModiaResult.ResultDict("time" => t,
                                "sigA" => sigA,
                                "sigB" => sigB,
                                "sigC" => sigC,
                                defaultHeading = "Three test signals",
                                hasOneTimeSignal = false)
showInfo(result)