ModiaPlot Documentation
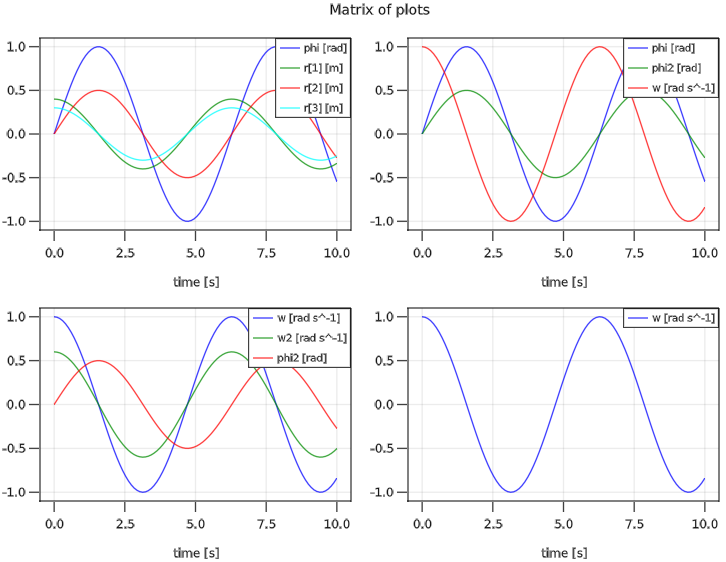
Package ModiaPlot provides a convenient interface to produce line plots of time series data where a time series is identified by a String key. The legends/labels of the plots are automatically constructed by the keys and the units of the time series. Example:
# result is a dictionary Dict{String,Any}.
ModiaPlot.plot(result, [ ("phi", "r")        ("phi", "phi2", "w");
                         ("w", "w2", "phi2") "w"                ],
               heading="Matrix of plots")
generates the following plot:
The underlying line plot is generated by GLMakie.
Installation
It can be installed in the following way (Julia >= 1.5 is required):
julia> ]add ModiaPlotRelease Notes
Version 0.7.1
- Updated dependent packages to their newest versions and adapted the compat section in Project.toml. Especially, GLMakie 0.2.4 is used (instead of 0.1.30).
Version 0.7.0
- Initial version, based on code developed for ModiaMath 0.6.x.
Main developer
Martin Otter, DLR - Institute of System Dynamics and Control